Why This Check Matters
Most beginners start by hunting for the biggest dividend yield. That makes sense, because a big percentage looks like big income. But a high yield only helps if the company can keep paying it. This guide teaches one simple check that looks at cash instead.
I’m a student, not an analyst, and I won’t tell you what to buy. Everything here comes from public filings that you can open and check yourself. If these terms feel confusing at first, that’s normal. We’ll go slowly.
Takeaway: a big yield means little if the cash isn’t there to pay it.
What the Free Cash Flow Payout Ratio Is
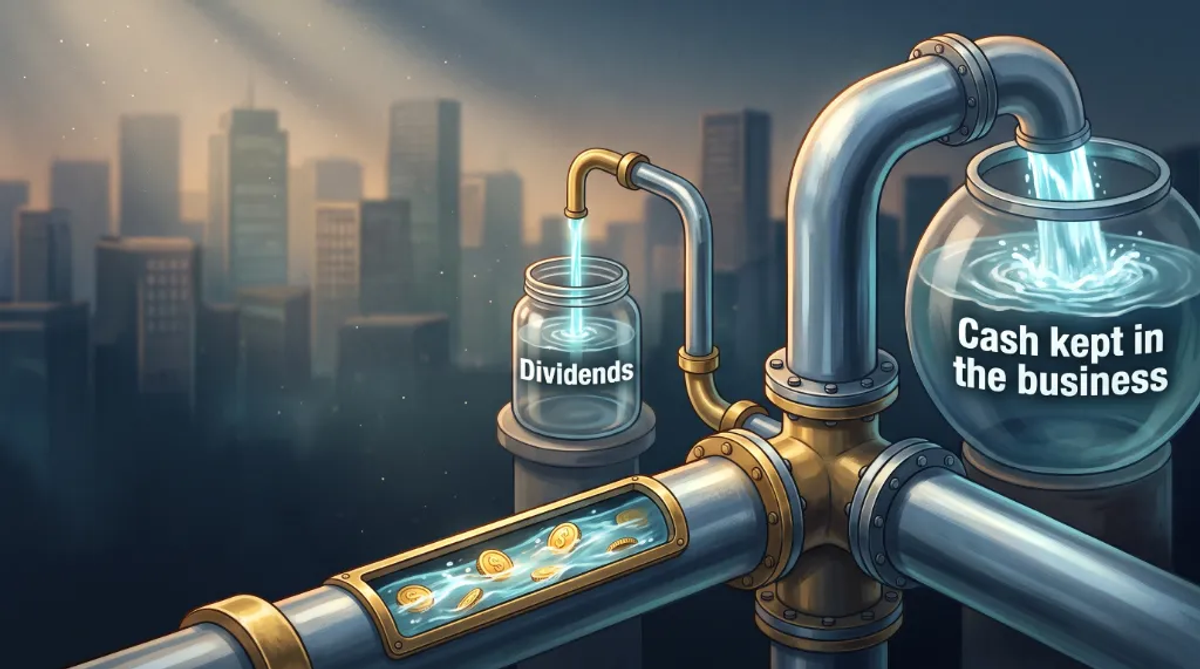
The free cash flow payout ratio shows how much of a company’s leftover cash goes to shareholders as dividends. Leftover cash is the money that remains after the company pays to run and maintain its business. Think of your own budget. If you spend every dollar of your paycheck, one surprise bill can cause trouble. Companies are the same.
There are two steps. First, free cash flow equals operating cash flow minus capital spending. Capital spending is money spent on things like equipment and buildings. Second, the payout ratio equals dividends paid divided by free cash flow, times one hundred.
Here is a made-up example. A company brings in one billion dollars from its operations and spends four hundred million on equipment and buildings. That leaves six hundred million dollars of free cash flow. If it pays two hundred forty million in dividends, the ratio is forty percent.
Takeaway: a low ratio means cash covers the dividend with room to spare, and a ratio above one hundred percent means the company paid out more than the cash it freed up.
Why Cash Tells a More Honest Story Than Earnings
A dividend is paid with real cash. Earnings, also called profit or net income, are an accounting result built from rules. Those rules can make profit jump or drop even when cash stays steady.
Two things often bend earnings. Some costs, like depreciation, lower profit without any cash leaving the company. And one-time events, like selling a business, can swing profit in a single year.
AT&T’s filings show how big this can get. For twenty twenty-five, it reported about twenty-three billion dollars of net income, which included a gain of about five and a half billion from selling DIRECTV. For twenty twenty-four, net income was about twelve billion, after roughly five billion dollars of write-downs and restructuring costs. Those swings were accounting events, not changes in daily business.
Takeaway: when profit jumps or falls because of a one-time event, the earnings-based ratio moves with it, so it pays to check cash too.
Where to Find the Numbers
You don’t need an expensive tool. Every public company files an annual report called a Form ten-K, and you can read it free on the SEC’s EDGAR website. The SEC’s investor education site says the section called Financial Statements and Supplementary Data holds the audited statements, including the statement of cash flows. That section is Item eight.
Search for the company on EDGAR, open its latest ten-K, and go to the statement of cash flows. You need three lines from it:
- Operating cash flow: look in the operating section for net cash provided by operating activities.
- Capital spending: look in the investing section for capital expenditures. Some companies call it purchases of property and equipment.
- Dividends paid: look in the financing section, where it usually sits.
Most ten-Ks show several years side by side. That lets you repeat the math for each year without opening more filings. Many companies also publish their own free cash flow table in an earnings release, and that table is worth reading.
Takeaway: you only need three lines from one statement, and the filing shows several years at once.
A Real Example From AT&T’s Filing
Let’s walk through AT&T’s own numbers. I’m using it only as a real example, not as a stock to buy. In an exhibit filed with the SEC in January twenty twenty-six, AT&T explains how it counts free cash flow.
It starts with cash from operations. Then it subtracts capital spending, payments for vendor financing, and some cash items tied to DIRECTV, a business it sold in July twenty twenty-five. Here are the rounded figures for twenty twenty-five:
- Cash from operations: about forty billion dollars.
- Capital spending: about twenty-one billion dollars.
- Vendor financing payments: about one point two billion dollars.
- DIRECTV cash items removed: about one point seven billion dollars.
- Free cash flow, AT&T’s way: about sixteen point six billion dollars.
- Dividends paid: about eight point two billion dollars.
Using AT&T’s own method, the payout ratio comes out to about forty-nine percent. Now try the simple way, which is only cash from operations minus capital spending. That gives free cash flow of about nineteen point four billion dollars and a payout ratio of about forty-two percent. For twenty twenty-four, the two methods gave about fifty-three and a half percent and about forty-four percent.
The gap comes from what each method subtracts. AT&T also removes vendor financing payments and the DIRECTV items. Neither number is wrong. They answer slightly different questions.
Takeaway: the same company and the same dividend can show two different ratios, so always check how free cash flow was defined.
Earnings Payout Ratio Versus Cash Payout Ratio
Now compare the two ratios side by side. Using AT&T’s filing, the earnings-based ratio was about thirty-five percent in twenty twenty-five. In twenty twenty-four, it was about sixty-seven percent. Those are my rough figures, using total dividends paid over total net income, and the dividends include some preferred shares.
The cash-based ratio barely moved. It was about forty-nine percent in twenty twenty-five and about fifty-three and a half percent in twenty twenty-four.
The swing in the earnings ratio came from the one-time items we saw earlier. The big DIRECTV gain made twenty twenty-five profit look high, so the dividend looked easy to pay. The write-downs made twenty twenty-four profit look low, so the dividend looked stretched. Cash told a steadier story.
Takeaway: use both ratios, and when they disagree, dig into the filing to find out why.
What Counts as a Healthy Ratio
No law or official rule sets a perfect ratio. But one line is clear. Above one hundred percent, the dividend is bigger than the free cash flow behind it, and the gap must come from savings or borrowing.
Below that line, it’s about how much cushion you want. Here is a rough guide for beginners, not an official standard:
- Below sixty percent usually means a wide cushion.
- Sixty to ninety percent means a thinner cushion, where one weak year could squeeze cash.
- Ninety to one hundred percent leaves almost no room for debt or growth.
Two habits matter more than any cutoff. Look at three to five years, because one year can be unusual. And compare with similar companies, because steady businesses can run higher ratios than ones whose cash swings with the economy.
Takeaway: treat these bands as a question to ask, not a verdict, because one ratio never proves a dividend is safe.
When the Ratio Can Mislead You
Even a good check can fool you if you don’t know the traps. Four situations deserve a second look, and each is easy to spot once you know it:
- Lumpy spending: a company that builds a big factory one year has low free cash flow that year, so look at several years.
- One-time cash items: AT&T’s method removes cash from a business it sold, so ask whether an excluded item is truly rare.
- Different definitions: two companies can build free cash flow differently, so compare only when the methods match.
- Negative free cash flow: if free cash flow is below zero, the ratio stops making sense, and any dividend is coming from savings or debt.
Real estate investment trusts, called REITs, are a special case. They have large depreciation costs that lower net income without cash leaving. So they often report funds from operations, or FFO, which adds depreciation back. The Motley Fool calls FFO a stand-in for free cash flow, not a full replacement. Adjusted versions like AFFO are not standardized, so check how each REIT builds its own.
Takeaway: if a ratio looks odd, check the years, the exclusions, the definition, and whether it’s a REIT.
The Dividend Coverage Ratio, Flipped
Some people like multiples better than percentages. The dividend coverage ratio flips the math upside down. It equals free cash flow divided by dividends paid, and it tells you how many times cash could pay the dividend.
A result of one means cash exactly covers the dividend. Anything below one means it doesn’t. In our made-up example, six hundred million divided by two hundred forty million gives two and a half times.
Using AT&T’s filing, coverage was about two times in twenty twenty-five and about one point nine times in twenty twenty-four. Those are the same facts as the payout ratio, just seen from the other side.
Takeaway: coverage and payout ratio are two views of the same math, so use whichever feels clearer to you.
Your Five-Step Checklist
You can run this check on any dividend stock in about fifteen minutes. Here are the steps in order:
- Step one: open the latest ten-K on EDGAR and find the statement of cash flows.
- Step two: write down operating cash flow, capital spending and dividends paid for the last three to five years.
- Step three: subtract capital spending from operating cash flow, then divide dividends by that number.
- Step four: read the company’s own free cash flow definition, if it has one, and see why it differs from yours.
- Step five: compare the result with the earnings payout ratio, the company’s debt, and similar companies. For a REIT, use FFO or AFFO.
Takeaway: the ratio is where your questions start, not where they end. If several years look strained, read more of the filing before you decide anything.
The Bottom Line
The free cash flow payout ratio asks one plain question: is this dividend paid from cash the business really makes? Cash is the fair yardstick, the ratio is only as good as its definition, and one year proves little. Look at several years and compare with similar companies.
If yield is still new to you, start with our guide, What Is a Dividend Yield? How to Find a “Good” One Today.
Mr Market’s dividend stock screener is coming soon, and it includes a free tier bonus for early users. It screens stocks by core value criteria, with an AI assistant, a beginner investing academy, a research memorandum and a value calculator. Join the waitlist on the homepage at mrmarket.online to hear when it launches.
This guide is for education only and is not investment, tax or legal advice. It does not recommend any stock, and AT&T appears only to show how to read a real filing. Investing involves risk, including loss of money.